
More Information
Submitted: 24 July 2019 | Approved: 26 August 2019 | Published: 27 August 2019
How to cite this article: Rique AM, Madeira M, Luis L, Fleius MLde F, Paranhos NF, et al. Evaluating cortical bone porosity using Hr-Pqct. Arch Clin Exp Orthop. 2019; 3: 008-013.
DOI: 10.29328/journal.aceo.1001006
Copyright Licence: © 2019 Rique AM, et al. This is an open access article distributed under the Creative Commons Attribution License, which permits unrestricted use, distribution, and reproduction in any medium, provided the original work is properly cited.
Keywords: X-ray; Microtomography; Cortical Porosity; Osteoporosis

Evaluating cortical bone porosity using Hr-Pqct
Rique AM1, Madeira M2, Luis L2, Fleius MLde F2, Paranhos NF2 and Lima I1*
1Nuclear Engineering Department, Federal University of Rio de Janeiro, COPPE, Brazil
2Endocrine Department, University Hospital Clementino Fraga, Federal University of Rio de Janeiro, Brazil
*Address for Correspondence: Lima I, Nuclear Engineering Department, Federal University of Rio de Janeiro, COPPE, Brazil, Tel: + 55 21 3938-8410; Fax: + 55 21 3938-8444; Email: [email protected]
This work aims to evaluate cortical porosity through a high-resolution peripheral quantitative micro-tomography in a group of 47 patients. All patients, in vivo, were subjected to the medical care protocol of the University Hospital Clementino Fraga, 020-213. Patients were women aged from 37 to 82 years old, who did not present fractures in their lower and upper limbs, all of them showing good health. During screening, they were required to have normal BMD (as determined by DXA; T-score ≥ 1.0) and no low-trauma fractures history. The exclusion criteria for all the individuals enrolled in this control study include, for example, alcoholism, chronic drug use, and chronic gastrointestinal disease. Male patients ranging from 42 to 79 years old presented the same health issues as women group. Results showed an increase in the amount of pores on the cortical bone of the evaluated patients over time; however, this increase was also observed in pore diameter, as well as a decrease in the border between the cortical and trabecular bone, indicating a deterioration in cortical bone quality over the years.
Osteoporosis has been defined as a systemic disease characterized by low bone mass and deterioration of the micro-architecture of the bone tissue, with consequent increase in bone fragility and fracture susceptibility. After the age of 50, 40% of women suffer from osteoporosis and one in every three women will suffer from osteoporotic fractures. At 80s and above, 70% of women with osteoporosis have at least one fracture, according to [1].
Besides affecting several people, osteoporosis is a disease evidenced mainly in women in menopause age. A factor observed and taken into account is bone mineral density (BMD) loss. This bone loss can be measured by X-ray absorptiometry [2], although this technique seems not to distinguish the border between the cortical and trabecular bones. Fractures commonly associated with osteoporosis are preferentially located in the proximal femur, vertebral bodies and distal radius (wrist). Individuals with a previous bone fracture history have an increased risk of future fractures [3]. Hip and vertebrae fractures are the most serious health risks associated with this disease, resulting in prolonged hospital care, reduced autonomy, reduced quality of life, and an increased mortality rate [4,5]. For instance, the percentage of deaths one year after a femoral fracture is estimated at 20% and 30%, with 50% remaining with disabilities. These events are related to bone loss. From 21 to 25 years old, BMD remains constant until the 4th or 5th decade of life, when a gradual physiological loss begins, proportional to the age increase. In women, this is associated with peri- and post-menopausal loss [6]. Because of its structural function, the bone is fundamental for locomotion, breathing and protection of the internal organs. And due to its metabolic function, it acts as a reservoir of calcium and phosphorus [5].
Bone samples evaluation (trabecular or cortical morphology and/or topology) can be performed using several techniques. Quantitative and qualitative information were used to determine micro-structural changes and to improve our understanding of osteoporosis and bone changes. It is fundamental that all the techniques involved be able to analyze these small structures (from 100 to 500μm of trabecular thickness). Although osteoporosis is one of the most common disorders today, it has still not been well understood and it has been the object of intensive study. The investigation of bone micro-architecture can provide major information, such as pore diameter, mineral concentrations, and morphological and topological parameters [7].
Many researchers validated tomography as the survey technique for bone morphometry; and its remarkable development is due to the fact that – unlike classical techniques such as histology – tomography does not harm the test sample. Six pathological bone samples were analyzed by microcomputed tomography, examining the three-dimensional structure and histomorphometric parameters. The reconstructed image was created by irradiating the sample with X-rays. The attenuation of the X-rays through the specimen was studied, since this is directly proportional to the density of the specimen [8].
Histomorphometric measurements may express bone tissue quantity, and formation and resorption rates, as well as provide data about its micro-architecture and trabecular connectivity [9]. They represent the quantitative form of bone components, i.e. perimeter, volume, area, thickness, and other parameters.
Computed tomography (CT) has evolved into an indispensable imaging method in clinical routine. It was the first non-invasive method to acquire images from within the human body that were not influenced by the overlap of different anatomical structures. Therefore, CT produces much higher contrast images compared to conventional radiography. During the 1970s, this was a large step towards improving the possibility of diagnosis in medicine [10].
X-ray microcomputed tomography (μCT) has been widely used to generate high-resolution images of trabecular and cortical bones with normal pathology in human and animal specimens [7]. Although μCT has effectively become the standard tool for quantifying bone morphology and microstructure, little has been done to establish μCT as a tool to provide a quantitative evaluation of bone tissue mineralization [5]. Currently, the images generated by μCT are used to quantify porosity in various materials and also in bone microstructures, as well as in bones with compact mass, such as the cortical bone.
High resolution peripheral quantitative computed tomography (HRp-QCT) has the advantage of assessing, in a non-invasive way, bone micro-architecture and it has been used to distinguish those with and without fracture in cross-sectional studies. Studies indicate that Chinese Americans have smaller bone size, denser and thicker cortices than white women in radius and tibia bones [11].
The tissues are formed by high density compact and resistant bones – called cortical bones and tissues formed by low density bone structures with greater porosity – called trabecular bones. These two types of bones can be evidenced as follows: the cortical bone (or compact/lamellar/dense) represents 70%-80% of the total bone mass, being found on the outer surface of all bones. Its main function is to provide rigidity to the bone, with its relative proportion depending on the function and mechanical load of the respective bone. It is characterized by a volumetric fraction (bone mass volume/total volume ratio) close to one, which justifies the name commonly used – compact bone [5].
The trabecular (or spongy) bone corresponds to the remaining 20%-30% of the bone mass, being located in the inner portion of the bone. It consists of a porous reticular structure with variable and relatively low density, which provides flexibility and resilience to the overall bone structure. These properties come from their ability to absorb energy from impacts. It is also characterized by a relatively low volumetric fraction, compensating with a surface area approximately twice as large as that of the compact bone [5].
For [12], 80% of the mineralized bone matrix of the skeleton are cortical and 20% are trabecular. Of all age-related appendicular bone loss, around 70% is cortical, and it is the result of the intracortical remodeling initiated with Haversian canals crossing the cortex.
With the emergence of HR-pQCT as a non-invasive instrument suitable for clinical use, cortical porosity at appendicular sites can be visualized directly, in vivo [13]. Investigating the cortical porosity is an important aspect in understanding the biological, pathoetiological and biomechanical processes that occur within the skeleton. In this sense, this study aims to evaluate cortical porosity through HRp-QCT in healthy patients in both female and male genders.
HRp-QCT (XtremeCT SCANCO model) was used in this study and the following technical characteristics are presented below.
Field of view of 126mm, maximum scan length > 150mm, resolution of 10% MTF equal to 130μm ± 20μm (patient protocol), reproducibility of density measurement < 0.3% CV (Phantom), isotropic default voxel size of 82μm, image matrix equal to 1536 x 1536 pixels (for a standard measurement at tibia or radius with 86mAs) with possibly up to 3072 x 3072 pixels, stack height > 8mm, detector size equal to 3072 x 255 pixels (170mm x 14.5mm).
3D HRp-QCT uses a 2D detector with an X-ray tube and a focus of 0.08mm, at a nominal resolution of 82μm with scanning of 2.8 minutes, at an effective dose of approximately 3.0μSv per measurement. The main parameters used for performing the exams follow the format established were voltage of 60KVp, current of 900mA, 750 projections/180° and image size matrix of 1536 x 1536 pixels. The equipment uses 0.3mm of Cu with 1mm of Al of physical filters in order to minimize beam-hardening artifacts. From the first slice, the operator performs the geometric contour of bone scanned. This design is followed automatically to the next slices, adjusting them as close as possible for each image. The scan process can eventually generate artifact due to the motion of the patient. In that sense, another examination could be repeated.
The analysis of the reconstructed images was performed according to Scanco’s algorithm and protocol. A set of measures can be extracted from the Scanco software (Table1).
| Table 1: Description of HRp-QCT parameters example extracted from 3D images. | ||
| HRp-QCT Parameters | Unit | Descriptions |
| Ct.vBMD | mgHA/ccm | Cortical Volumetric Bone Mineral Density |
| Ct.Pm | mm | Cortical Endosteal Perimeter |
| Ct.Th | mm | Cortical Thickness |
| Ct.Po | % | Intra-Cortical Porosity |
| Ct.Po.Dm | mm | Cortical Pores Diameter |
Subjects
A group of 47 patients aged 37-82 years from the University Hospital (UH) presenting reports of good health was used as control. All patients were Brazilian, 24 men and 23 women and their tibia and radius bones were examined.
The control groups were screened and required to have normal BMD (as determined by DXA; T-score ≥ 1.0) and no low-trauma fractures history. The exclusion criteria for all the individuals enrolled in this control study were as follows: alcoholism, chronic drug use, chronic gastrointestinal disease, renal or hepatic impairment, and exposure to anticonvulsants, bisphosphonates, teriparatide, strontium ranelate, or denosumab [14]. Prior to commencement of micro-tomography examination, the patients were subjected to anamnesis and clinical examination by UH physicians.
The evaluations were performed on the radius and tibia bones of the non-dominant sides. For a better result, it was necessary to proceed with pre-calibration and calibration procedures and to maintain patient in the still position at the moment of the examination, which occurred after patient’s extremities immobilization. The patient’s wrist is placed comfortably on a carbon fiber module with Velcro fastenings. After placing the member to be irradiated in the equipment, an X-ray is taken with the purpose of visualizing the field to be scanned. At this examination point, the part of the tibia or the radius to be examined is selected. The reference line for conducting the examination is placed on the border (plateau) of the tibia or radius, from approximately 1/3 to 1/2 towards the middle of the axis in the horizontal direction. This procedure guarantees a correct determining of tomographic region, radius or tibia, with better visibility and accuracy. This region always comprises 110 slices or a scanned region with 9.02mm in length.
If a fracture or an implant is within the planned measurement area, the contralateral side should be measured. It must be ensured that the patient is not using any highly attenuating objects, such as a watch or jewelry within the measurement area. The measurements were performed at the distal extremities of the radius and ipsilateral tibia to obtain volume density and cortical and trabecular micro-architecture.
Parameter evaluation
The 2D and 3D histomorphometric evaluation can be performed in a rectangular/cubic volume or any ROI/VOI (Region/Volume of Interest) irregularly. The ROI/VOI is defined by a set of Graphic Objects (GOBJs), which can be contours or geometric objects, such as rectangles or ellipses. The ROI/VOI must be designed in a slice-based method. 3D shape can be defined by drawing objects in all consecutive slices or by creating a “hull” between two slices (interpolating the intermediate slices, or morphing). The defined ROI/VOI is stored on the disc and will be reloaded when the measurement data is reloaded. Exactly the same VOI, therefore, can be re-evaluated at a later time [15].
The measurement time per stack (100 slices) was of 2.8 minutes for a standard measurement of the tibia or radius, using the following parameters Ct.Po (intracortical porosity), CtvBMD (cortical volumetric bone mineral density), Ct.Po.Dm (cortical pores diameter) and Ct.Th (cortical thickness). For data analysis, we have applied software Statistica. We have also evaluated the cortical bones – radius and tibia – parameters Ct.Po, CtvBMD, Ct.PoDM in relation to age, as well as cortical thickness for both genders.
Tables 2 and 3 shows HRpQCT results. Cortical porosity.
| Table 2: HRpQCT Parameters for Radial Cortical Bone Micro-structure in Women and Men. | ||
| Parameters | Gender | |
| Women (N = 23) | Men (N = 24) | |
| Average age (years) | 64.6 ± 13.5 | 61.2 ± 9.3 |
| CtPo (%) | 0.0296 ± 0.032 | 0.028 ± 0.014 |
| CtvBMD (mgHA/ccm) | 874.2 ± 92.8 | 898.2 ± 44.0 |
| CtPoDm (mm) | 0.16 ± 0.02 | 0.26 ± 0.4 |
| Table 3: HRpQCT Parameters for Tibia Cortical Bone Micro-structure in Women and Men. | ||
| Parameters | Gender | |
| Women (N = 23) | Men (N = 24) | |
| Average age (years) | 64.6 ± 13.5 | 61.2 ± 9.3 |
| CtPo (%) | 0.06 ± 0.03 | 0.06 ± 0.02 |
| CtvBMD (mgHA/ccm) | 880.2 ± 72.8 | 895.5 ± 60.2 |
| CtPoDm (mm) | 0.18 ± 0.02 | 0.19 ± 0.02 |
HQp.CT analysis becomes important in vivo in studies evaluating bone resistance, characteristic of micro-architectures that occur with advancement of age and menopause, in the case of women.
In the first evaluation, the parameter Ct.Po was used for discovering the radius and tibia cortical porosity in lower and upper limbs extremities. This increase in porosity characterizes a property that will influence the cortical bone mechanics, as well as the bone mineral density, which has mineralization as predominant factor. In this sense, CtvBMD and pore diameter, Ct.Po.Dm, were evaluated. Ct.Po.Dm increased linearly according to age increase.
Figure 1 shows the results for the number of pores versus age on the radius bone in the female group. It is possible to observe an increase in porosity in the female group aged from 37 to 82 years. The tibia bone also showed an increase in porosity with an increase in age. Apparently, it was a mild inclination, since the patients were in good health and did not characterize any apparent anomaly, according to UH clinical protocol.
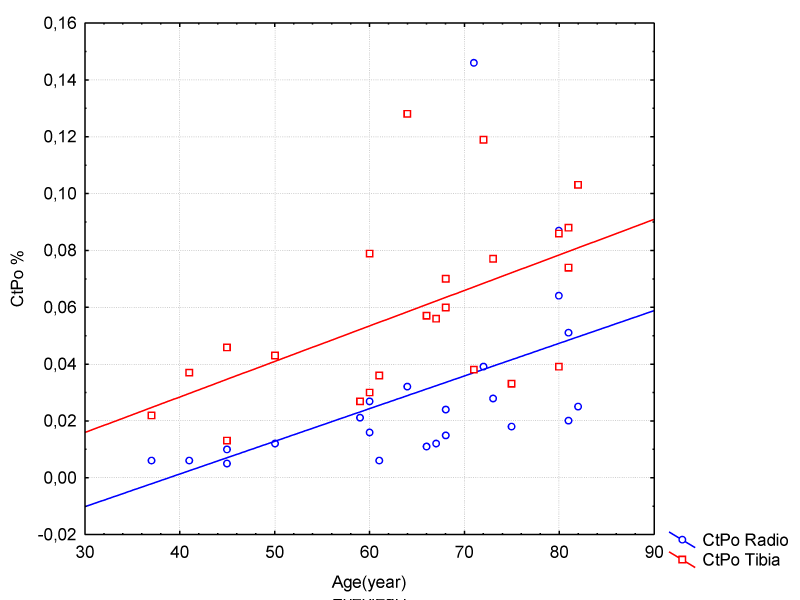
Figure 1: Correlation Between Age and Porosity on Radio/Tibia Bones – Female Group.
CtPo presented a gradual increase in the group of women over 37 years old and yet it characterizes a good bone structure of the radius. The CtPo values ranged from 0.01 to 0.08, with an average value of 0.030 and standard deviation of 0.03.
The tibia bone showed a greater difference in cortical porosity for the same group of women, where the porosity ranged from 0.02 to 0.10, with an average value of 0.06 and standard deviation of 0.03. The study points to a correlation between the increase in CtPo and an increase in CtPoDm in the radius and tibia bones.
Regression summary for dependent variable: Porosity R = 0.5/R² = 0.2 adjusted R² = 0.2 F (1.2) = 6.3 p <. 02 Std. error of estimate 0.03.
CtvBMD indicated a decrease in the same age range for the female group, where it can be said that the natural demineralization of the bone occurs, and not characterizing bone anomaly (Figure 2).
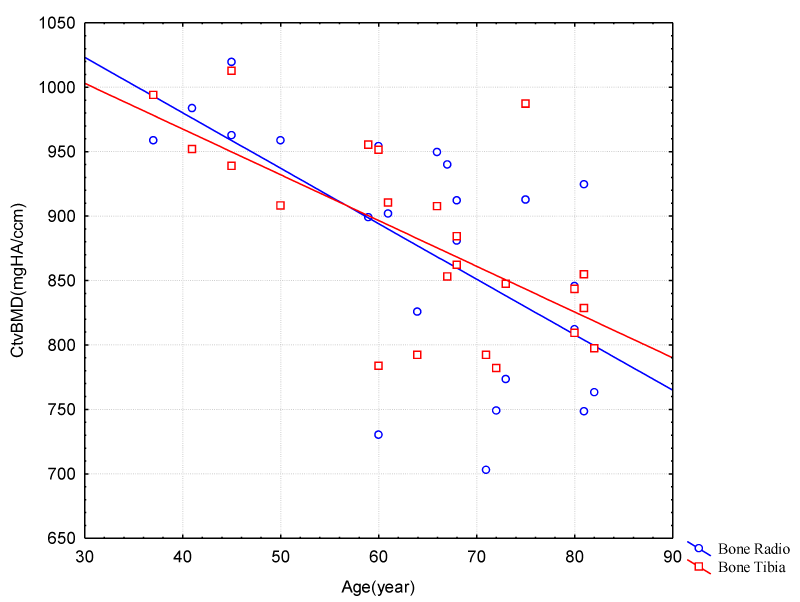
Figure 2: Correlation between Age and Cortical Volumetric Bone Mineral Density (Radio/Tibia Bones – Female Group).
There was a higher concentration in the increase of CtPoDm over 60 years for both tibia and radius. The tibia had a gradual increase; however its values were higher than those of the radius (Figure 3).
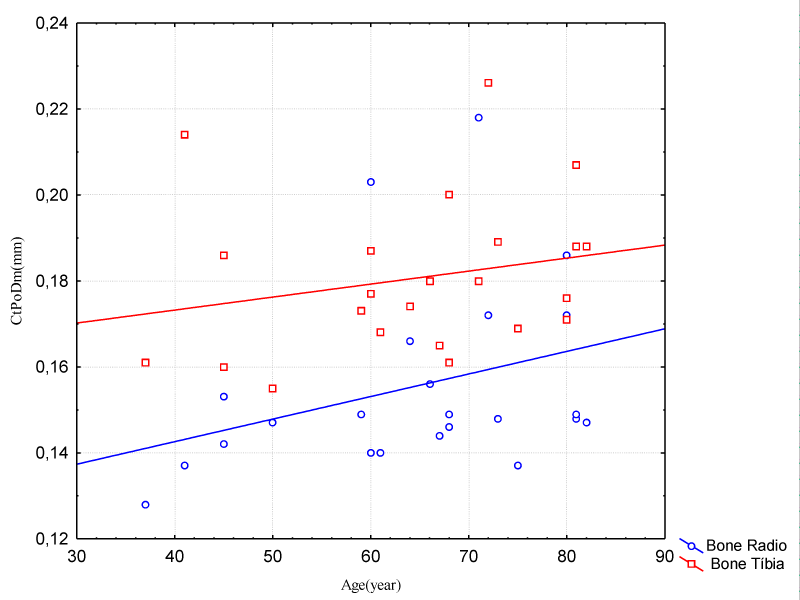
Figure 3: Correlation Between Age and Cortical Pores Diameter (Radio Bone – Female Group).
CtPo showed a gradual increase in the group of men over 40 years old and yet it characterizes a good bone structure of the radius. The values of CtPo comprised between 0.01 and 0.07, with an average value of 0.03 ± 0.01. For tibia cortical porosity, the mean value was 0.06 ± 0.02. The tibia presented greater porosity than the radius in the same period. The radius CtPo had an increase of 7% in the period of approximately 40 years. This increase in tibia CtPoDm may be due to actions of greater mechanical impact during this period, according to Figure 4.
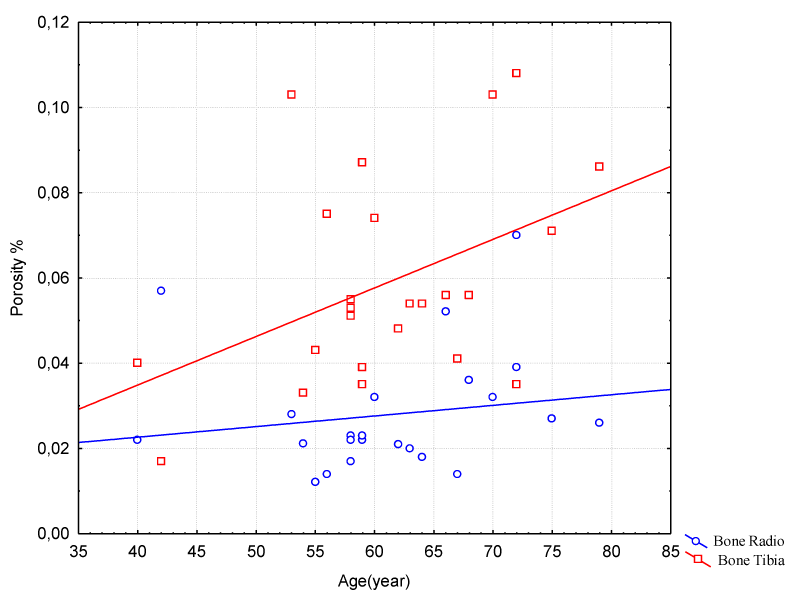
Figure 4: Correlation between Age and Porosity on Radio/Tibia Bones – Male Group.
CtvBMD in the group of men ranging 55 to 79 years characterized a concentration between 960mgHA/ccm and 860mgHA/ccm, showing a decrease of 100mgHA/ccm in 24 years approximately. Tibia indicated a greater decrease in its density in this same age range, Figure 5.
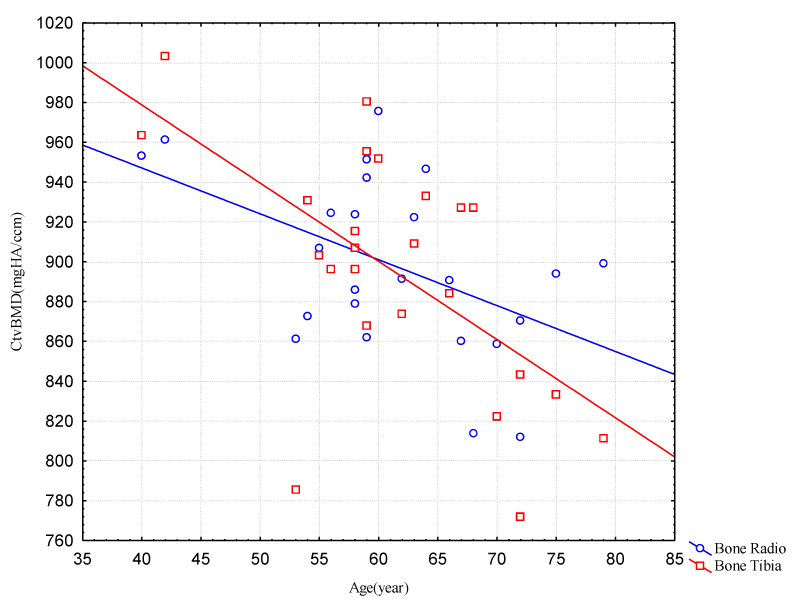
Figure 5: Correlation between Age and Cortical Volumetric Bone Mineral Density Radio – Male Group.
CtPoDm values for tibia in male group, Figure 6, were among 0.1 and 0.2 with an average value of 0.20 ± 0.02. We may affirm that there was no significant increase in CtPoDm for the radius bone to be considered bone loss. CtPoDm values for radius were between 0.13 and 0.19 in the period of approximately 30 years, with an average value of 0.16 ± 0.02 and age: CtPoDm radius r2 = 0.006 age: CtPoDm tibia r2 = 0.01.
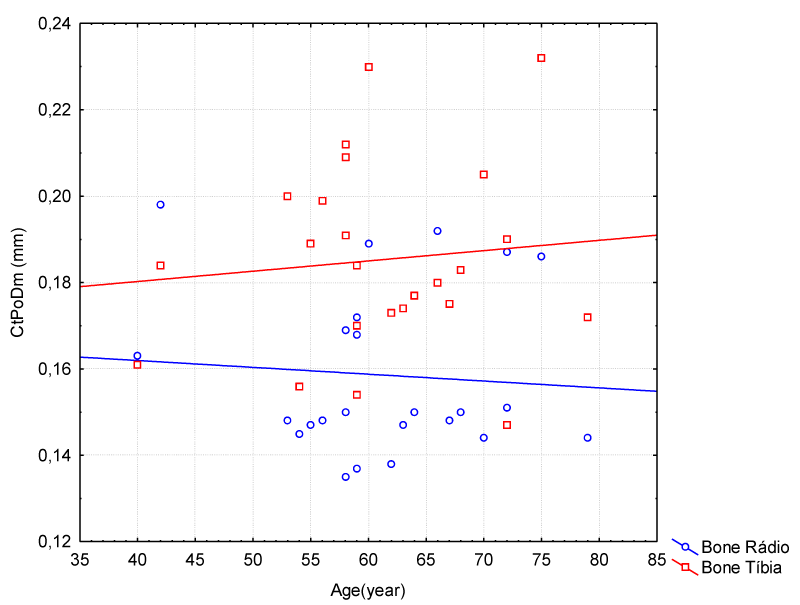
Figure 6: Correlation between Age and Cortical Pores Diameter (Radio/Tibia Bones – Male Group).
Figure 7 indicates a decrease in cortical thickness in the same period for both bones, radius and tibia, being more severe for tibia, maintaining the same proportion approximately. Ct.Th, valid N = 24, mean = 1.3, minimum = 0.9, maximum = 1.8 Std.Dev = 0.24 for tibia. Ct.Th radius valid N = 24, mean = 1.0, minimum = 0.7, maximum = 1.7, Std.Dev. = 0.2.
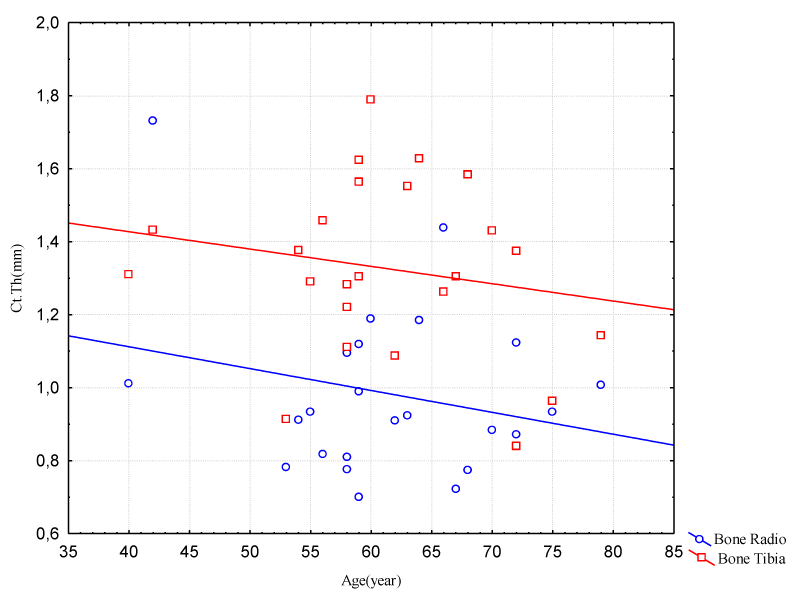
Figure 7: Correlation between Age and Cortical Thickness (Radio/Tibia Bones – Male Group)
HR-pQCT is a promising non-invasive method for 3D characterization in vivo of human bones [16,17]. Cortical bone is responsible for peripheral skeleton load and for bone mass loss and the bone structure impairment may reduce fracture resistance and increase its occurrence. In this sense, its evaluation became important with methods that use software applied in HRpQCT.
Zerbine, et al. [18] suggest that interventions oriented for preserving bone mass may be helpful in elderly men and [19], showed increased porosity ranging from 6% to 16% and from 9% to 28% in the distal radius and tibia, respectively, through a quadratic relationship between cortical porosity and age from 20 to 98 years. In particular, this increase with the age was much more severe after menopause. This device latest generation is capable of a nominal isotropic resolution of 82μm. This allows quantifying geometric, micro-structural, densitometric, and mechanical properties of human cortex and trabecular bone in the appendicular skeleton (distal radius and tibia) [20].
The porosity quantification has shown to increase in healthy individuals and showed the bone loss for both genders within the assessed age range.
This study has shown that pore diameter increase, bone density decrease, porosity increase and cortical thickness decrease are part of the bone natural aging process, with a decline in its formation, for both sexes [21].
Cortical bone shows a well-defined structure bordering the trabecular bone, when the patient presents normality. In the presence of some abnormality or disease that might decrease bone density, its structure presents a greater fragility with the increase of pores in its longitude [22]. This greater presence of pores contributes to the increase in fractures in both women and men. Bone mineral density for both sexes showed a decline in the age range compatible with the stability post plateau indicated by research, which happens over 40 years, approximately. Therefore, bone fragility due to aging increases proportionally to the cortical porosity rise.
- Verron E, Gauthier O, Janvier P, Pilet P, Lesoeur J. In vivo bone augmentation in an osteoporotic environment using bisphosphonate-loaded calcium deficient apatite. Biomaterials. 2010; 31: 7776-7784. PubMed: https://www.ncbi.nlm.nih.gov/pubmed/20643480
- Panattoni GL, D'amelio P, Di Stefano M, Sciolla A, Isaia GC. Densitometric study of developing femur. Calcified Tissue International. 1999; 64: 133-136.
- Klotzbuecher CM, Ross P, Blumberg P, Thomas AA, Marc B. Patients with Prior Fractures Have an Increased Risk of Future Fractures: A Summary of the Literature and Statistical Synthesis. J Bone Miner Res. 2000; 15: 721-739. PubMed: https://www.ncbi.nlm.nih.gov/pubmed/10780864
- Seeman E. Bone quality. Osteoporosis Int. 2003; 14(suppl): 5-7.
- Digirolamo DJ, Kiel DP, Esser KA. Bone and skeletal muscle: neighbors with close ties. J Bone Miner Res. 2013; 28: 1509-1518. PubMed: https://www.ncbi.nlm.nih.gov/pubmed/23630111
- Black DM, Clifford J, Rosen MD. Postmenopausal Osteoporosis. N Engl J Med. 2016; 374: 254-262.
- Lima I, Farias MLF, Percegoni N, Rosenthal D, Assis JT, et al. Micro imaging analysis for osteoporosis assessment. Spectrochimica Acta. 2010; 65: 253-257.
- Marinozzi F, Marinozzi A, Zuppante FBF, Pecci R, Bedini R. Variability of morphometric parameters of human trabecular tissue from coxo-arthritis and osteoporotic samples. Ann Ist Super Sanità. 2012; 48: 19-25. PubMed: https://www.ncbi.nlm.nih.gov/pubmed/22456011
- Brandi ML. Microarchitecture, the key to bone quality. Rheumatology. 2009; 48: iv3–iv8. PubMed: https://www.ncbi.nlm.nih.gov/pubmed/19783591
- Buzug TM. Computed Tomography From Photon Statistics to Modern Cone-Beam CT, Springer, 2008.
- Silva BC, Walker MD, Abraham A, Boutroy S, Zhang C, et al. Trabecular Bone Score Is Associated With Volumetric Bone Density and Microarchitecture as Assessed by Central QCT and HRpQCT in Chinese American and White Women. J Clin Densitom. 2013; 16: 554-561. PubMed: https://www.ncbi.nlm.nih.gov/pubmed/24080513
- Zebaze R, Ghasem-Zadeh A, Mbala A, Seeman E. A new method of segmentation of compact-appearing, transitional and trabecular compartments and quantification of cortical porosity from high resolution peripheral quantitative computed tomographic images. Bone. 2013; 54: 8-20. PubMed: https://www.ncbi.nlm.nih.gov/pubmed/23334082
- Tjong W, Nirody J, Burghardt AJ, Carballido-Gamio J, Kazakiae GJ, et al. Structural analysis of cortical porosity applied to HR-pQCT data. Med Phys 2014; 41: 013701. PubMed: https://www.ncbi.nlm.nih.gov/pubmed/24387533
- Madeira M, Vieira Neto L, De Paula Paranhos Neto F, Lima I, Carvalho De Mendonça LM, et al. Acromegaly Has a Negative Influence on Trabecular Bone, But Not on Cortical Bone, as Assessed by High-Resolution Peripheral Quantitative Computed Tomography, J Clin Endocrinol Metab. 2013; 98: 1734-1741. PubMed: https://www.ncbi.nlm.nih.gov/pubmed/23482608
- Xtreme CT. User’s Guide, SCANCO MEDICAL AG Fabrikweg 2 CH-8306. Bruettisellen Switzerland. 2013.
- Laib A, Hauselmann HJ, Ruegsegger P. In vivo high resolution 3D-QCT of the human forearm. Technol Health Care. 1998; 6: 329-37. PubMed: https://www.ncbi.nlm.nih.gov/pubmed/10100936
- Muller R, Hildebrand T, Hauselmann HJ, Ruegsegger P. In vivo reproducibility of three-dimensional structural properties of noninvasive bone biopsies using 3D-pQCT. J Bone Miner Res. 1996; 11: 1745-1750. PubMed: https://www.ncbi.nlm.nih.gov/pubmed/8915782
- Zerbini CAF, Latorre MRO, Jaime PC, Tanaka T, & Pippa MGB.. Bone mineral density in Brazilian men 50 years and older. Braz J Med Biol Res. 2000; 3: 1429-1435. PubMed: https://www.ncbi.nlm.nih.gov/pubmed/11105094
- Macdonald HM, Nishiyama KK, Kang J, Hanley DA, Boyd SK. Age-related patterns of trabecular and cortical bone loss differ between sexes and skeletal sites: a population-based HR-pQCT study. J Bone Miner Res. 2011; 26: 50-62. PubMed: https://www.ncbi.nlm.nih.gov/pubmed/20593413
- Burghardt AJ, Buie HR, Laib A, Majumdar S, Steven K. Reproducibility of direct quantitative measures of cortical bone microarchitecture of the distal radius and tibia by HR-pQCT. Bone. 2010; 47: 519-528. PubMed: https://www.ncbi.nlm.nih.gov/pubmed/20561906
- Dunsmuir JH. X ray Microtomography. ExxonmMobil Research and Engineering. Co. Annadale NJ. 1990.
- Feldkamp LA, Goldstein SA, Parfitt AM, Jesion G, Kleerekoper M. The direct examination of three-dimensional bone architecture in vitro by computed tomography. J Bone Miner Res. 1989; 4: 3-11. PubMed: https://www.ncbi.nlm.nih.gov/pubmed/2718776